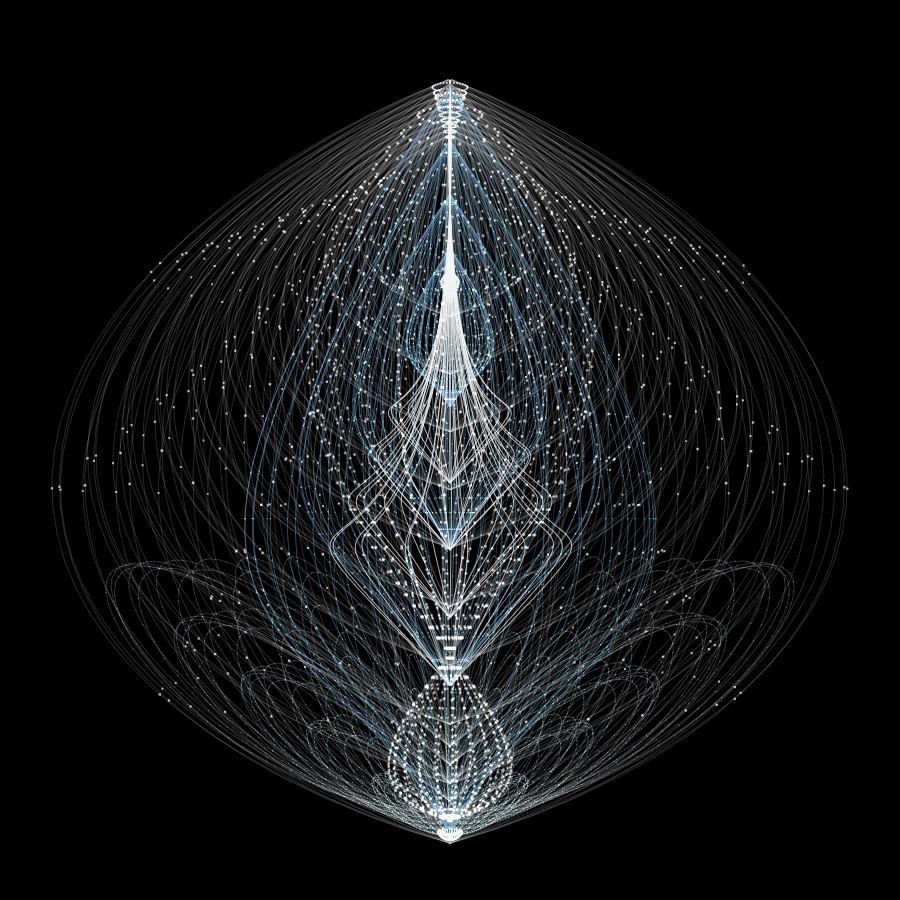
I was unable to upload even the shortest video because it was too long for my instance. Therefore, please enjoy the following:
- Partial visualization of test data. I cut this short because it took 40 seconds to do just a few (out of 81) paths: https://youtube.com/shorts/7UvzgSsMQNA
- Partial visualization of full data. I cut this short because I didn’t want to wait 40 minutes. It’s sped up 2x by making it 60fps (each step is approximately one frame) https://youtu.be/cv9qSdrV2Z4
- Full visualization, but it only shows the end paths, not individual steps: https://youtube.com/shorts/ozQ77ikI7JI
Unfortunately youtube is forcing my videos to be shorts due to aspect ratio and length, I don’t know if I can force them to a regular video
Nice. Roassal? Is that Smalltalk then?
Yep, I took the opportunity to learn smalltalk while doing aoc
Have you published the source for this somewhere? I’m interested in seeing what Roassal is like to use.
Here’s the code. Everything prefixed with ‘RS’ is from Roassal. Alternatively, just look at where I use
canvas. Keep in mind this is quick spaghetti code, and it includes the full solution for day 10 part 2.day10p1vis: in | input starts canvas | canvas := RSCanvas new. input := CTNewArray2D fromArray: ((in copyWithRegex: '\n|\r' matchesReplacedWith: '') collect: [ :v | v asString asInteger ] as: Array) width: (in lineNumber: 1) size. input withIndexesDo: [ :x :y :val | canvas add: (RSLabel new size: 5; text: val; x: x * 12; y: y * 12) ]. canvas signalUpdate. (canvas @ RSCanvasController) open. 14 seconds wait. starts := (input contents indicesOf: 0) collect: [:v | input indexToCoord: v]. d9heads := OrderedCollection new. ^ starts sumNumbers: [ :s | | thead | canvas signalUpdate. 0.08 seconds wait. d9heads removeAll. thead := RSBox new size: 12; position: s * 12; color: Color red translucent. canvas add: thead. self d9graphvis: input start: s dir: -1@0 canvas: canvas. ]d9graphvis: input start: start dir: dir canvas: canvas | next sum direc bounded bnext | bounded := [ :p | (p x between: 1 and: input width) and: [ p y between: 1 and: input height ] ]. direc := dir. sum := 0. 4 timesRepeat: [ next := start + direc. bnext := RSBox new size: 12; position: next*12; color: Color blue translucent. canvas add: bnext. "canvas signalUpdate." "0.034 seconds wait." sum := sum + ((bounded value: next) ifTrue: [ ((input at: next) = 9 and: [(input at: start) = 8]) ifTrue: [ bnext color: Color green translucent. 1 ] ifFalse: [ (input at: next) = ((input at: start) + 1) ifTrue: [ | t | t := self d9graphvis: input start: next dir: direc canvas: canvas. t = 0 ifTrue: [ self canvasRemove: { bnext } canvas: canvas ]. t ] ifFalse: [ self canvasRemove: { bnext } canvas: canvas. 0 ] ] ] ifFalse: [ self canvasRemove: { bnext } canvas: canvas. 0 ]). direc := direc rightRotated. "canvas signalUpdate." "0.034 seconds wait." ]. ^ sum.Great, thanks! I’ve always had Roassal at the back of my mind as a way of generating visualisations for AOC, but never got round to it. This might kick-start me, but maybe for next year at this point :-)
I haven’t but I can send it here, when I get home


