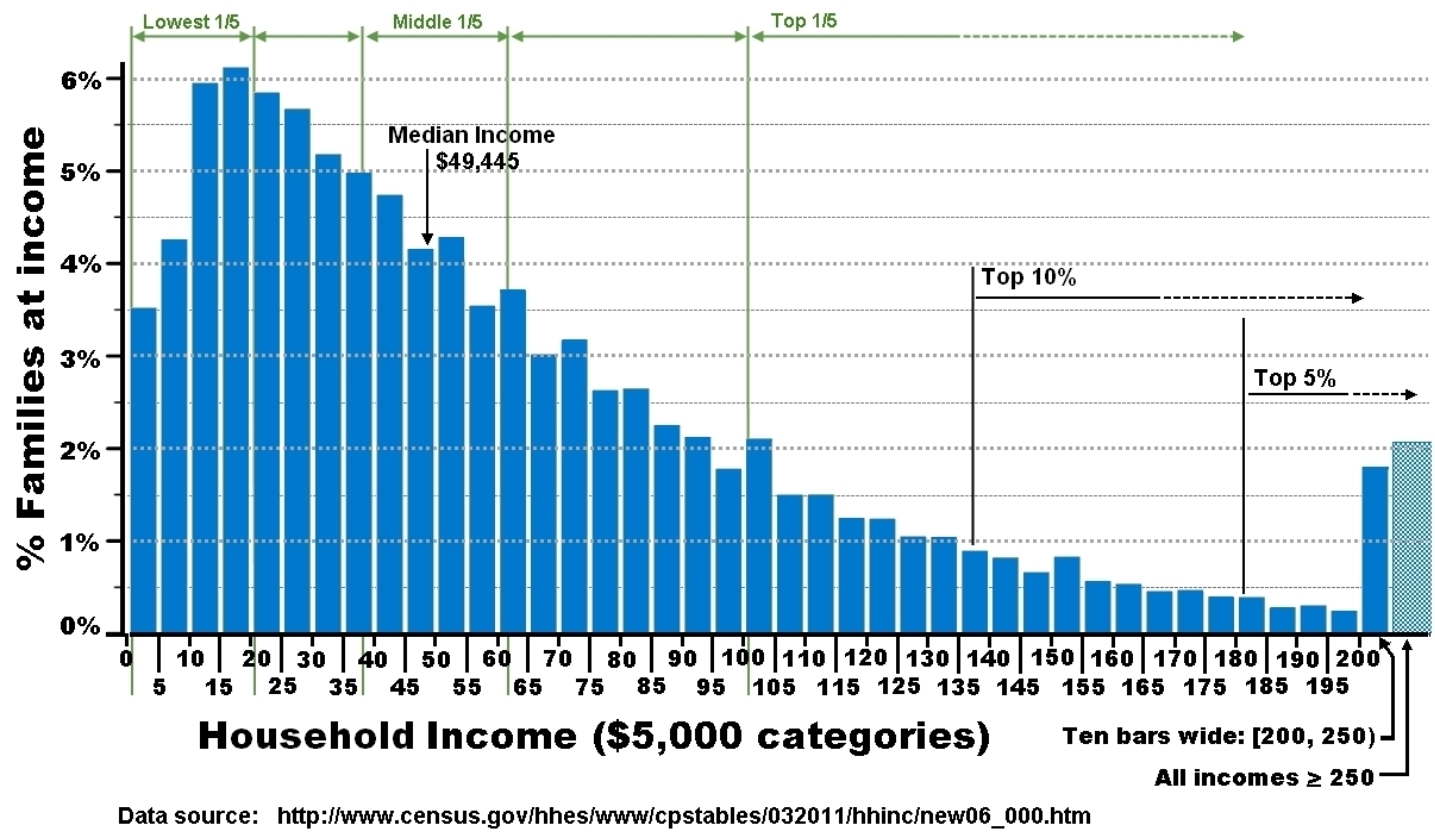
Median is the middle point of the population and has its place when the range doesn’t skew too much. I think a good representation of income is by percentages, as in “90% of people make $x,000 or below”. This chart had dated (2010) data but its a better representation than I’ve found elsewhere
Is this fact/accurate??
Excluding top 1000 drops the average in half??
Definitely a reason to only ever use median instead.
Median is the middle point of the population and has its place when the range doesn’t skew too much. I think a good representation of income is by percentages, as in “90% of people make $x,000 or below”. This chart had dated (2010) data but its a better representation than I’ve found elsewhere