

Hate to ruin your narrative here, but the [Republican controlled] House controls the government coin purse.
The first part’s not true. I love to tear down narratives. So I’m going to dissect the last paragraph with prejudice.
Blame Republicans if you want
I do.
but save some for the president and congressional Democrats. Biden rebranded as a deficit hawk after the FY2022 budget process,
Makes sense given our massive deficit.
the FY2023 spending bill was passed under the Democratic trifecta, and the FY2024 appropriations bills were enacted with overwhelming Democratic support at Biden’s urging.
We’re also funding two wars abroad, so that also makes sense. Also, those were the appropriations bills that needed to pass to prevent the government from shutting down. Because those are used every frigging year to hold the country for ransom, usually by Republicans. So of course compromises would be required to pass the least-worst of those lest we get absolutely nothing at all and the whole government shuts down (again).
We’ve got a bipartisan problem here.
BoTh SidES!!!1!!
This isn’t both sides, this is straight anti-biden propaganda.
Oh, yeah. 100%.
My “Both sides” rebuttal was simply to the last sentence in the
article’sblog post’s summary paragraph.
but but but gEnOsiDe jOe!!/1
Social spending was also up in 21 and 22 because of Covid.
Wow, military spending went up when a major world power invaded a sovereign nation? I’m sure this is all Biden’s fault.
Hold the fuck up
This has got to be wrong
The IRA alone was a trillion dollars, roughly speaking, in new “social and economic spending”. Where is that on this chart?
I’m gonna do some digging and see what this is. My guess is that “social and economic spending” is cunningly defined as within certain existing programs, which took a back seat to the massive new programs which are not included, but let me see what I can find about it.
Edit: Yeah, I’m pretty sure this is 100% just made up numbers. Like literally just writing any random shit on the chart and bald faced lying that it’s the actual numbers. He has citations, but they’re all citations to other articles of his.
Here are the numbers:
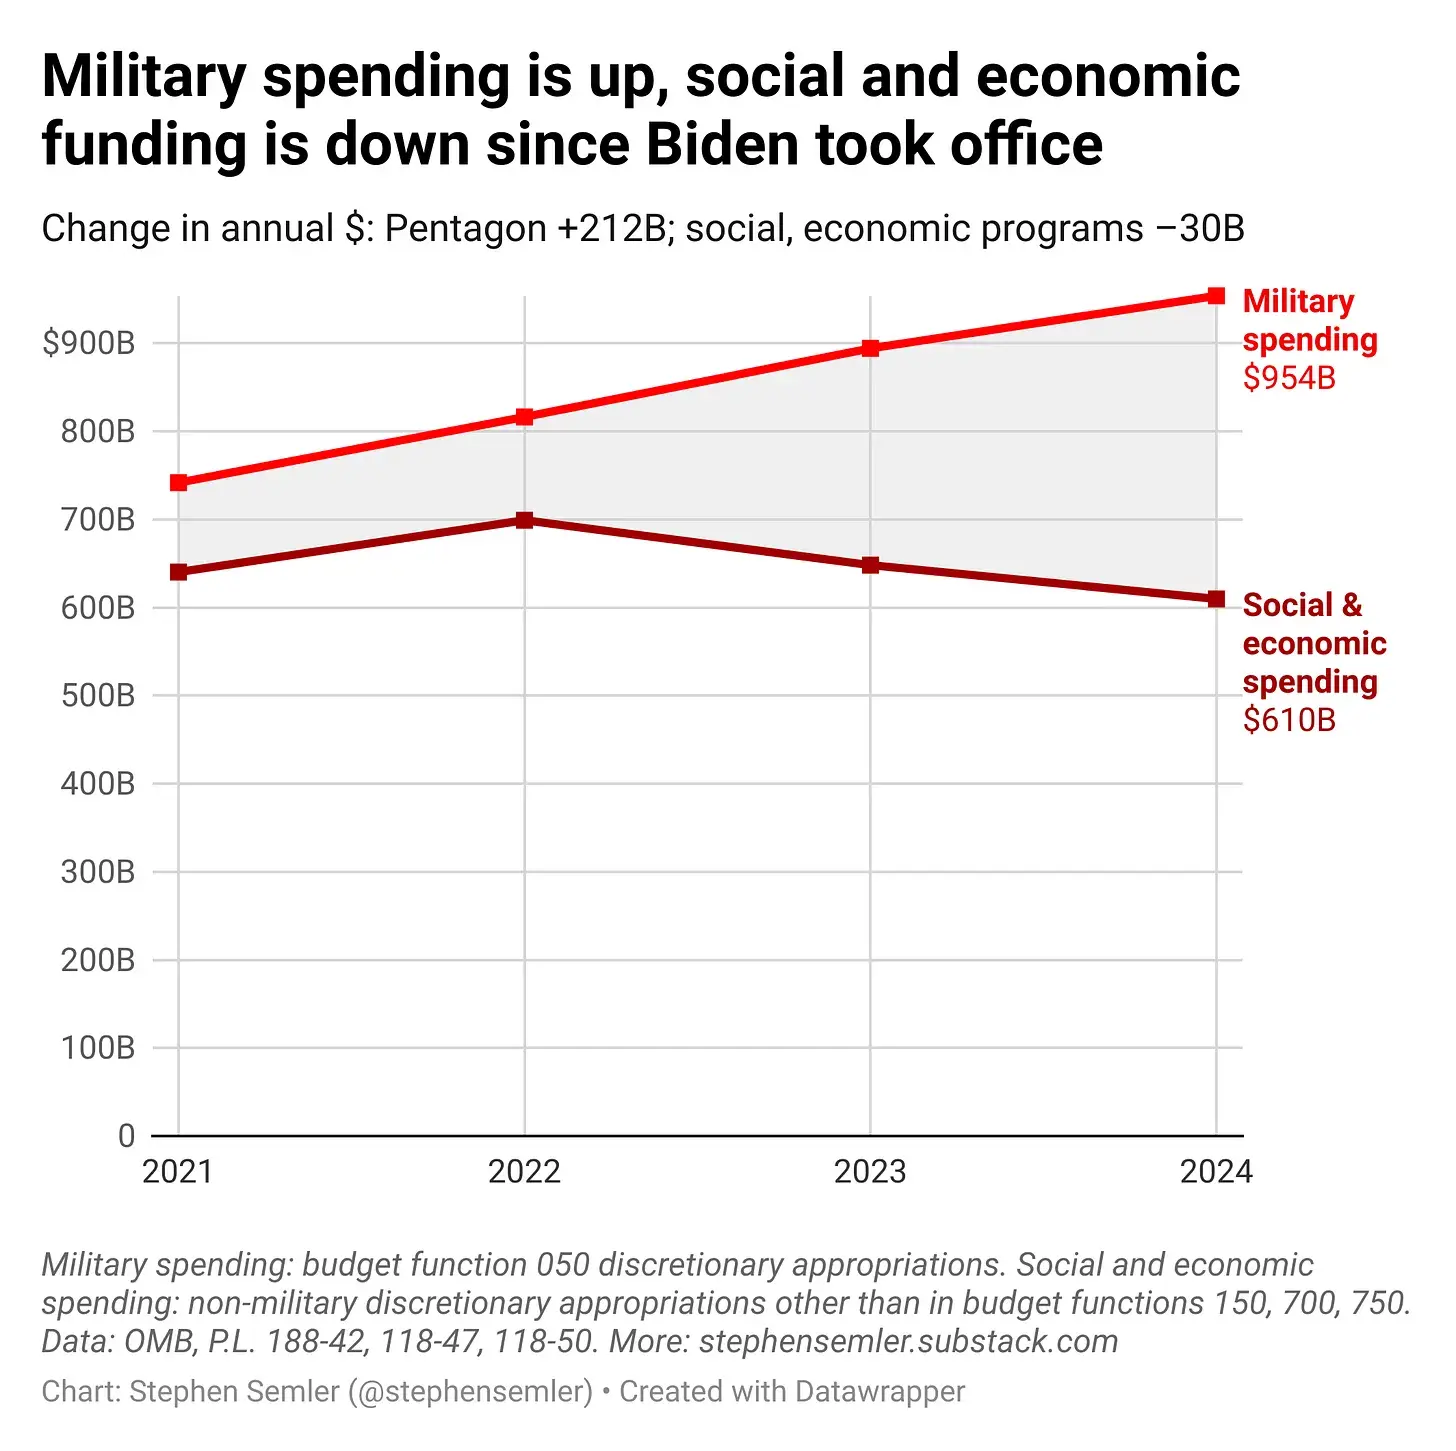
Military spending is easy to measure, because it’s a whole separate slice in the infographic. It went up, but not to where he says – over those three years it went from $742B to $751B to $805B. His chart shows it climbing up way up to $900B.
Social spending is a little more complex, because it’s not a single category in the same way, but you can literally add up things that are separated on the chart and see that even the sum of selected social/economic programs adds up to more than he says. I knew this was wrong because the scale of social spending, under Biden or before him, was so massive that you don’t even have to get detailed to show why it’s wrong.
- 2022: Student loan programs + income security + medicaid + medicare + social security = $3.6 trillion
- 2023: Income security + medicaid + medicare + social security = $3.3 trillion
He doesn’t really break down what he means by “economic and social,” so maybe he’s using a definition that doesn’t include social security or student loan forgiveness in social and economic spending or something, but given the fact that he lied about military spending I feel fairly comfortable saying that he probably just made up some random shit and posted up a chart full of Fox News style total lies.
For 900 billion we could buy nine Elon Musks or like six Putins.
The US spent 629 billion on Medicare alone in 2024.
https://fiscaldata.treasury.gov/americas-finance-guide/federal-spending/
Don’t fall for falsified data.
This is discretionary spending
Edit: I have no idea why this is getting downvotes.
Ah. That should probably be in the headline then, instead of just “spending” and “funding”.
Regardless, the figures are still inaccurate.
The $1.6 trillion in discretionary spending for FY24 is split between $842 billion for defense programs and $758 billion for nondefense activities, reflecting respective 3% and 7% boosts from FY23 enacted levels.
https://about.bgov.com/brief/federal-appropriations-for-fy24/
Edit: I have no idea why this is getting downvotes.
Because you made it clear in this comment that the headline is biased by using incomplete terms and trying to hide what the actual spending was.
Remember that nobody uses votes as intended, and nobody will ever manage to change that.
Because making this distinction (apparently for no reason at all except that it provides a misleading way to present data that have nothing to do with the reality) is a bunch of bullshit.
If you had said “here is how this data is false and what is the real information” I think you would be getting upvotes
This may not be the intent on your part, but it kinda comes across like “oh this data isn’t a TOTAL bunch of bullshit, and here is a random arbitrary distinction underlying it which wasn’t mentioned which totally makes it make sense to present these numbers this way,” and my guess is you’re getting downvotes because if that were what you were saying, that would be simply doubling down on the dishonesty of the original chart, and people are downvoting it for dishonesty
Because making this distinction (apparently for no reason at all except that it provides a misleading way to present data
Congress/the President don’t pass budgetary acts to set non-discretionary spending. The income/costs are statuary, and so their changes aren’t tied to the horse trading that routinely occurs as part of the appropriations process.
here is a random arbitrary distinction underlying it
The Appropriations Committee holds enormous influence over our national budgetary agenda precisely because they dictate how much money is made available to the various agencies. This isn’t random or arbitrary, it is fundamental to how Congress functions under Article One of the US Constitution.
This is where the “GOTV WE NEED TO FIX THINGS” rhetoric rubber hits the fucking road. You’re not going to change how Social Security or Medicare operates from cycle to cycle, but you absolutely are going to change how the Dep of Ed, the Highway and Transportation Administration, and the Pentagon function.
What on earth are you talking about?
Setting aside the dishonesty of excluding medicare, medicaid, social security, and the big assistance programs that got passed recently from the “social / economic programs” line on a chart of government spending, yes of course congress / the president pass budgetary acts that set non-discretionary spending. That’s how that spending got there in the first place. Where did you think medicare and medicaid and the student loan forgiveness programs and everything got into the non-discretionary budget in the first place, if not from congress and the president passing budgetary acts?
(This annoyed me so much that I went back and added a downvote to the pile for you)
Setting aside the dishonesty
How is a discussion of discretionary spending changes dishonest? It’s the thing Congress sets every two years.
congress / the president pass budgetary acts that set non-discretionary spending
That’s not how the Social Security Trust or the Medicare Trust Fund work. You don’t appropriate funds at the start of every budget cycle to pay for them.
Mm hm
What’s your explanation for the military budget thing?
Pentagon Spending is part of the Biannual NDAA, which falls under the purview of Appropriations.
Because of some of the COVID social programs, that chart should go back another 5 years, or so, to show a more accurate picture of the trend. I have no idea what it would look like, but my first thought is that 2022 is when the remaining COVID protections started being phased out which would, obviously, reduce the spending number. So, going back to 2019 and even 2018 would give us a better idea of the relative spend now versus then.
deleted by creator
Nah blogspot is okay with removing Nazi hate speech.
deleted by creator
This is a bad graph, it only shows 4 data points so it carries no context. Show it over 12 or 16 years otherwise the context is lost.
Social and economic funding went down? It’s almost as if the GOP obstructs all progress when a Dem administration is in power… anyone remember that infrastructure bill? Or student loan forgiveness? Or funding for abortion access?
Shame on you.
This chart is misleading. It just shows “discretionary” spending which leaves out Medicare Social Security, and Medicaid. (We spend considerably more on those programs than the entire military)
Once evil strongmen Putin and Xi are out of power, we can hopefully ratchet that down.


